
Free calculator · no signup
Waist to Height Ratio Calculator: Keep Your Waist Under Half Your Height
Enter your waist and height to get your waist to height ratio on the NICE bands: 0.40 to 0.49 healthy, 0.50 to 0.59 increased, 0.60 or more high, the same for men and women. You also see half your height, the line to stay under, and how far your waist is from it.
CostFree
TimeUnder 1 min
SignupNone
DataKept on device
The same boundary for men and women, so there is nothing to pick.
Units
Waist
cmHeight
cmWaist midway between your lowest rib and the top of your hip bone, which is just above the belly button, breathing out normally. Tape level and snug, not pressing.
NICE guideline NG246 (2025) protocol
Your ratio shows here as soon as your waist and height are in.
Start your glow up
SkinPal on iPhone and Android
Next step · SkinPal app
Half your height is the line. SkinPal helps you hold it.
Your height is fixed; your waist is not. SkinPal builds your glow up plan: exercise, daily habits, styling and skin care, reminds you every day, and shows your before and after week by week.

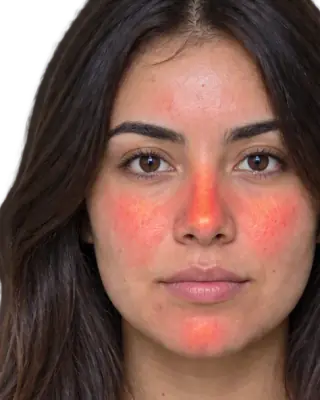
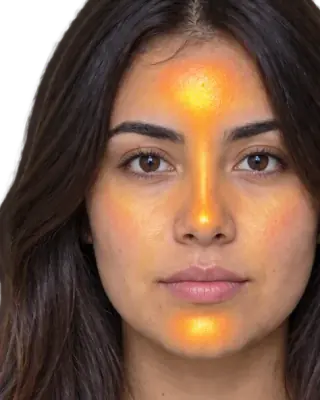

What you unlock in the app
- Full face analysisProportions, symmetry and skin, measured from one selfie
- Full skin report cardSee what's good and what needs work, from acne to skin age
- Heatmaps of your faceSee exactly where redness, oil and breakouts are
- Flare, your AI skin coachAsk anything, get answers based on your own face
- Morning and night routineMade for you, and it changes as you improve
- Ingredient scannerKnow if a product suits you before you buy it
- Progress trackingSee your before and after, week by week
The science
What should your waist to height ratio be?
01
Your waist to height ratio is your waist divided by your height, in the same unit. The boundary is 0.5: keep your waist to less than half your height, the message Margaret Ashwell has argued for since 1996 (Ashwell and Hsieh, 2005, set out why) and the UK’s NICE adopted in its 2025 obesity guideline (NG246).
02
NICE grades it in three bands for adults of both sexes and all ethnicities with a BMI under 35: 0.40 to 0.49 healthy, 0.50 to 0.59 increased risk, 0.60 or more high risk, meaning no increased, increased and further increased health risks. Under 0.40 NICE does not grade; Ashwell’s shape chart calls it take care.
03
The 0.5 comes from the evidence: a review of 78 studies from 14 countries found a mean boundary of 0.50 for men and women (Browning, Hsieh and Ashwell, 2010), and a meta-analysis of 31 studies and more than 300,000 adults found the ratio better than waist alone or BMI at picking out diabetes, high blood pressure and heart disease (Ashwell, Gunn and Gibson, 2012).
Waist to height ratio chart: the waist for your height
Half your height is the line. The chart gives the waist range for each band at common heights; the calculator works it out for yours.
| Height | Healthy (0.40 to 0.49) | Increased (0.50 to 0.59) | High (0.60 or more) |
|---|---|---|---|
| 150 cm (4 ft 11 in) | Healthy: 60 to under 75.0 cm (23.6 to 29.5 in) | Increased: 75.0 to under 90 cm | High: 90 cm (35.4 in) or more |
| 155 cm (5 ft 1 in) | Healthy: 62 to under 77.5 cm (24.4 to 30.5 in) | Increased: 77.5 to under 93 cm | High: 93 cm (36.6 in) or more |
| 160 cm (5 ft 3 in) | Healthy: 64 to under 80.0 cm (25.2 to 31.5 in) | Increased: 80.0 to under 96 cm | High: 96 cm (37.8 in) or more |
| 165 cm (5 ft 5 in) | Healthy: 66 to under 82.5 cm (26.0 to 32.5 in) | Increased: 82.5 to under 99 cm | High: 99 cm (39.0 in) or more |
| 170 cm (5 ft 7 in) | Healthy: 68 to under 85.0 cm (26.8 to 33.5 in) | Increased: 85.0 to under 102 cm | High: 102 cm (40.2 in) or more |
| 175 cm (5 ft 9 in) | Healthy: 70 to under 87.5 cm (27.6 to 34.4 in) | Increased: 87.5 to under 105 cm | High: 105 cm (41.3 in) or more |
| 180 cm (5 ft 11 in) | Healthy: 72 to under 90.0 cm (28.3 to 35.4 in) | Increased: 90.0 to under 108 cm | High: 108 cm (42.5 in) or more |
| 185 cm (6 ft 1 in) | Healthy: 74 to under 92.5 cm (29.1 to 36.4 in) | Increased: 92.5 to under 111 cm | High: 111 cm (43.7 in) or more |
| 190 cm (6 ft 3 in) | Healthy: 76 to under 95.0 cm (29.9 to 37.4 in) | Increased: 95.0 to under 114 cm | High: 114 cm (44.9 in) or more |
| 195 cm (6 ft 5 in) | Healthy: 78 to under 97.5 cm (30.7 to 38.4 in) | Increased: 97.5 to under 117 cm | High: 117 cm (46.1 in) or more |
Waist to height ratio bands: healthy, increased, high
NICE’s 2025 guideline (NG246, recommendations 1.9.14 and 1.9.15) grades central adiposity by the ratio. Ashwell, who sat on the committee, set the original boundaries on her shape chart: 0.5 where heart disease risk was seen to start in UK survey data, and 0.6 so that about as many people sat above it as had a BMI over 30, then 16% of men and 11% of women.
| Ratio | NICE NG246 | What it means |
|---|---|---|
| Under 0.40 | Below the healthy range | NICE does not grade it; Ashwell’s shape chart labels it take care, as a waist this small for the height can go with being underweight. |
| 0.40 to 0.49 | Healthy | Healthy central adiposity in NICE’s guideline: no increased health risks. |
| 0.50 to 0.59 | Increased risk | Increased central adiposity in NICE’s guideline: increased health risks. |
| 0.60 or more | High risk | High central adiposity in NICE’s guideline: further increased health risks. |
Waist to height ratio for men and women
One boundary for everyone is the ratio’s main advantage: men and women, every ethnicity NICE reviewed, and children and young people too. Height scales the waist for frame, which is why a tall person can carry a waist that would be high on someone shorter. For a ratio that does split by sex, the waist to hip ratio calculator reads the same waist against your hips on the WHO cut-offs.
Waist to height ratio vs BMI
BMI divides weight by height squared, so it cannot tell muscle from fat or say where the fat sits. The waist to height ratio reads the waist, where the fat that tracks heart and metabolic risk sits. In the 2012 meta-analysis it improved on BMI by 4 to 5% at telling people with and without those outcomes apart, against 3% for waist alone. NICE’s guideline now asks for it alongside BMI for adults with a BMI under 35.
How to lower your waist to height ratio
Height does not change, so the ratio moves only with the waist: every 1 cm off the waist at 170 cm takes about 0.006 off the ratio, so a 0.05 change is about 8.5 cm. Measure the same way once a month to see it. To see how much of the waist is fat, the body fat calculator turns a waist and neck measurement into body fat.
FAQ
Common questions
What should my waist be at 5 ft 7 in?+
Under 33.5 inches (85 cm) for a ratio under 0.5, half of 67 inches. NICE’s healthy band, 0.40 to 0.49, is a waist from 26.8 inches up to just under 33.5.
Is a 32 inch waist obese?+
The ratio answers it against your height: a 32 inch waist is under half the height of anyone taller than 5 ft 4 in (64 inches), so it reads healthy above that and 0.50 or more at 5 ft 4 in and below. NICE calls 0.50 to 0.59 increased central adiposity, not obesity; obesity is defined on BMI.
What is a good waist to height ratio?+
0.40 to 0.49, which NICE calls healthy central adiposity, with no increased health risks. From 0.50 the risk is increased, and from 0.60 further increased.
Is the waist to height ratio the same for men and women?+
Yes. The 0.5 boundary held for both sexes in the review of 78 studies (Browning et al. 2010), and NICE’s bands apply to both sexes and all ethnicities, for adults with a BMI under 35 and, in the same guideline, children and young people.
Is the waist to height ratio better than BMI?+
In the meta-analysis of more than 300,000 adults it picked out diabetes, high blood pressure and heart disease better than BMI and better than waist alone (Ashwell, Gunn and Gibson 2012). In 1,453 UK adults, 35% of those the BMI and waist chart rated no increased risk had a ratio of 0.5 or more (Ashwell and Gibson 2016).
What does a waist to height ratio of 0.6 mean?+
High central adiposity in NICE’s guideline: further increased health risks, including type 2 diabetes, high blood pressure and cardiovascular disease. Ashwell’s shape chart labels 0.6 and above take action. It is a risk marker; a doctor can check what it means for you.
How do I measure my waist for the waist to height ratio?+
NICE’s way: find the bottom of your ribs and the top of your hips, wrap the tape midway between them, which will be just above the belly button, and breathe out naturally before reading it. Measure your height without shoes.
Keep going
Waist to hip ratio calculator →
Your waist to hip ratio against the WHO cut-off for men and women, and what your waist alone reads.
Body fat calculator →
Your body fat percentage from a tape measure (US Navy method), with its error, the healthy range for your age and a drawn body fat chart.
Height calculator →
How tall will you be? Adult height predicted from both parents (mid-parental and Khamis-Roche), plus your percentile on the CDC and WHO charts.