Free calculator · no signup
Body Fat Calculator: Your Body Fat Percentage From a Tape Measure
Enter your height and a tape at your neck and waist (and hips, for women) to get your body fat percentage by the US Navy method, the range its error spans, and where it sits on the published healthy ranges for your sex and age. You see yourself drawn among the body fat levels, and the number carries over to the FFMI calculator. No photo, and weight is optional.
CostFree
TimeUnder 1 min
SignupNone
DataKept on device
Sex
Units
Height
cmWeight (optional, for fat and lean mass)
kgTape measure
Neck
cmWaist at the navel
cmNeck just below the Adam’s apple, waist at the navel, standing relaxed after breathing out. The US Navy method’s standard error is 3.5 points of body fat, and the result shows that range.
Your body fat shows here as soon as height, neck and waist are in.
Start your glow up
SkinPal on iPhone and Android
Next step · SkinPal app
Body fat is the lever. SkinPal keeps you on it.
Lower body fat shows your jaw and changes how clothes sit. SkinPal builds your glow up plan around it: exercise, daily habits, styling and skin care, reminds you every day, and shows your before and after week by week.
What you unlock in the app
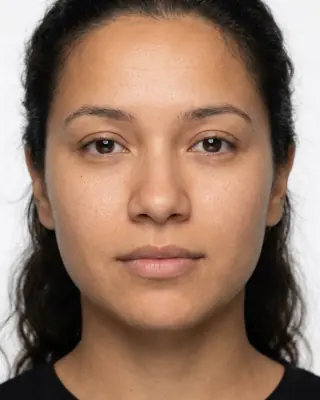
- Full face analysisProportions, symmetry and skin, measured from one selfie
- Full skin report cardSee what's good and what needs work, from acne to skin age
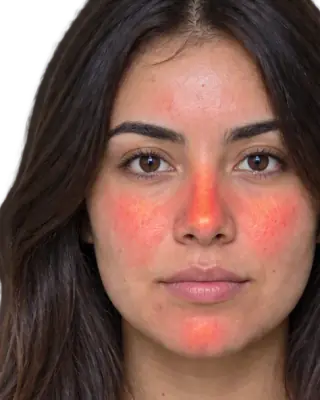
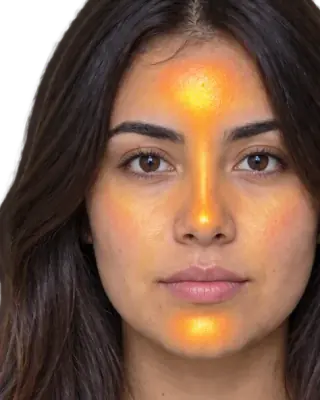
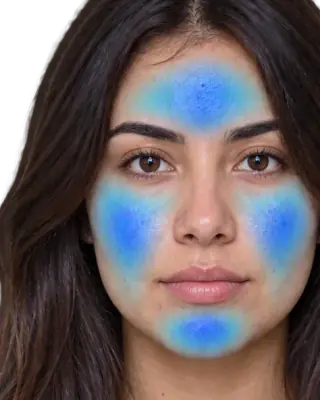
- Heatmaps of your faceSee exactly where redness, oil and breakouts are
- Flare, your AI skin coachAsk anything, get answers based on your own face
- Morning and night routineMade for you, and it changes as you improve
- Ingredient scannerKnow if a product suits you before you buy it
- Progress trackingSee your before and after, week by week
The science
How the body fat calculator works
01
This body fat calculator uses the US Navy circumference method, published by Hodgdon and Beckett at the Naval Health Research Center in 1984. Men give their height, neck and waist at the navel; women add their hips at the widest point. The tape gives your body density through two log equations, and Siri’s equation, 495 ÷ density − 450, turns density into percent body fat.
02
It is an estimate, and the result says how good: against underwater weighing, the method’s standard error was 3.5 points of body fat in men and 3.7 in women, so about two in three people measure within that distance of their true number. For a man, a reading of 18.0% is best read as 14.4 to 21.5%, and the result shows that range.
03
The number is then read on the ranges Gallagher and colleagues published in 2000 (American Journal of Clinical Nutrition). They measured 1,626 adults at Cambridge, Columbia and Jikei universities with a four-compartment model and DXA, and worked out the body fat that goes with a BMI of 18.5, 25 and 30, the underweight, overweight and obesity lines, by sex and age. That is where the healthy range for your age comes from.
Body fat percentage chart for men and women
Most body fat percentage pictures online are photos of different people, so height, muscle, lighting and pose change from one picture to the next along with the fat. The chart below is drawn instead: every figure is the same body with one thing changed, the waist the US Navy formula gives at that body fat. The labels are the Gallagher 2000 ranges for ages 20 to 39.
Read it as what a tape can tell. Two people at the same body fat can look different, because muscle and where fat sits vary, and a lean figure with little muscle looks smaller, not more defined. Your own result draws you among the levels at your own height and neck.
Men: body fat 10 to 35%
10%
waist 77 cm
healthy
15%
waist 83 cm
healthy
20%
waist 90 cm
overweight
25%
waist 97 cm
obese
30%
waist 105 cm
obese
35%
waist 115 cm
obese
Women: body fat 15 to 40%
15%
waist 60 cm
below
20%
waist 64 cm
below
25%
waist 69 cm
healthy
30%
waist 74 cm
healthy
35%
waist 79 cm
overweight
40%
waist 85 cm
obese
Healthy body fat percentage by age: the Gallagher chart
Gallagher and colleagues tied body fat to the BMI lines everyone already used: the body fat that goes with a BMI of 18.5 is the bottom of the healthy range, 25 the start of the overweight range and 30 the start of the obesity range. Body fat at the same BMI rises with age, so the ranges do too.
| Age | Below healthy | Healthy | Overweight range | Obese range |
|---|---|---|---|---|
| 20 to 39 | Below healthy: under 8% | Healthy: 8 to 19.9% | Overweight range: 20 to 24.9% | Obese range: 25% or more |
| 40 to 59 | Below healthy: under 11% | Healthy: 11 to 21.9% | Overweight range: 22 to 27.9% | Obese range: 28% or more |
| 60 to 79 | Below healthy: under 13% | Healthy: 13 to 24.9% | Overweight range: 25 to 29.9% | Obese range: 30% or more |
These ranges are for African American and white adults. In the study’s Asian adults, measured in Japan, the same BMI lines fell higher in the younger groups, by up to 5 points: a healthy range of 13 to 22.9% for men aged 20 to 39 and 25 to 34.9% for women of that age. By 60 to 79 the two tables are within a point of each other (Table 5 of the paper).
Body fat percentage chart for women by age
Every range for women sits 11 to 14 points above the men’s at the same age. The calculator reads a woman’s result on this table.
| Age | Below healthy | Healthy | Overweight range | Obese range |
|---|---|---|---|---|
| 20 to 39 | Below healthy: under 21% | Healthy: 21 to 32.9% | Overweight range: 33 to 38.9% | Obese range: 39% or more |
| 40 to 59 | Below healthy: under 23% | Healthy: 23 to 33.9% | Overweight range: 34 to 39.9% | Obese range: 40% or more |
| 60 to 79 | Below healthy: under 24% | Healthy: 24 to 35.9% | Overweight range: 36 to 41.9% | Obese range: 42% or more |
For the Asian women in the study the healthy range ran 25 to 34.9%, 25 to 34.9%, 25 to 35.9% for the three age groups. The ranges are a study’s provisional guidelines, not a diagnosis: the authors offered them as groundwork for international ranges.
Navy body fat calculator: the formula and a worked example
All lengths in centimeters. If you enter inches, the calculator converts them first: 1 inch is 2.54 cm. Here is a man 178 cm tall with a 38 cm neck and an 87 cm waist, and a woman 165 cm tall with a 32 cm neck, a 70 cm waist and 97 cm hips.
- Step 1Men: density = 1.0324 − 0.19077 × log10(waist − neck) + 0.15456 × log10(height). For the example man, waist − neck is 49, so density = 1.0324 − 0.3224 + 0.3478 = 1.0578.
- Step 2Women: density = 1.29579 − 0.35004 × log10(waist + hips − neck) + 0.22100 × log10(height). For the example woman, waist + hips − neck is 135, so density = 1.2958 − 0.7457 + 0.4901 = 1.0402.
- Step 3Body fat % = 495 ÷ density − 450 (Siri). The man: 495 ÷ 1.0578 − 450 = 18.0%. The woman: 495 ÷ 1.0402 − 450 = 25.9%.
- Step 4The range is one standard error either side: 14.4 to 21.5% for him (±3.5), 22.2 to 29.6% for her (±3.7).
On the Gallagher ranges for ages 20 to 39, his 18.0% is in the healthy range for men, 8 to 19.9%, and her 25.9% is in the healthy range for women, 21 to 32.9%. For him, the top of the healthy range comes at a waist of about 89.7 cm with the same neck: about 2.7 cm more than now.
How to measure for the most accurate result
The tape decides the result more than anything else: each centimeter on the example man’s waist moves him about 0.75 points.
- Step 1Neck: just below the Adam’s apple, the tape sloping slightly down toward the front, snug but not pressing.
- Step 2Waist: men at the navel, women at the narrowest point between ribs and hips. Stand relaxed, feet together, and measure after breathing out, without pulling the stomach in.
- Step 3Hips, women only: around the widest part of the buttocks, the tape level all the way round.
- Step 4Take each measurement twice and use the average; measure height without shoes. For a trend, measure at the same time of day, before eating.
How accurate is a body fat calculator? Every method’s error
No home method is exact, and the honest question is how far off each one runs. These are the published errors, each against a lab reference.
| Method | Error | Against what, and who |
|---|---|---|
| US Navy tape (this calculator) | ±3.5 points men, ±3.7 women | Standard error against underwater weighing (Hodgdon and Beckett 1984, as tabled by the Institute of Medicine, 1998). |
| BMI equation | ±5.0 points | Standard error of Gallagher’s 2000 equation against a four-compartment model, African American and white adults. |
| Relative fat mass | Middle half of errors 4.2 points wide (men), 4.9 (women) | From waist and height, against DXA in 3,456 US adults (Woolcott and Bergman 2018); its waist is taken at the top of the hip bone. |
| DXA scan | ±3.2 points | Against the four-compartment model, the study’s UK and US subjects (Gallagher et al. 2000). |
This calculator uses one method, the Navy tape, because neither alternative is more accurate with what you can measure at home: the BMI equation has the larger error, and relative fat mass needs its waist at a third spot and spreads about as wide. Showing the Navy number with its range is more useful than averaging methods whose errors overlap.
Body fat percentage from height and weight alone
If you have no tape, BMI gives a rougher number. Gallagher’s 2000 equation for African American and white adults: body fat % = 64.5 − 848 ÷ BMI + 0.079 × age − 16.4 × sex + 0.05 × sex × age + 39.0 × sex ÷ BMI, with sex 1 for men and 0 for women. Its standard error is 5.0 points.
For the example man, 82 kg at 178 cm and age 30, BMI is 25.9 and the equation gives 20.7%: overweight range, where his tape says 18.0%, healthy. BMI counts muscle as if it were fat, so it reads trained people high, which is why the calculator asks for a tape.
Body fat, FFMI and what lower body fat shows
Body fat says how much of you is fat; the FFMI calculator takes the rest, your lean mass, and says how much muscle that is for your height, up to the drug-free limit of 25 for men. Your result here carries over: the FFMI calculator fills in your height, weight and tape from this device.
Lower body fat is also what changes the face first: fat under the chin and along the jaw is what hides the jaw corner. If your jawline analysis reads soft, body fat is the lever to check before anything else. For a single number on fat around the middle, the waist to height ratio calculator reads your waist against half your height.
FAQ
Common questions
How accurate is the Navy method for body fat percentage?+
Its standard error against underwater weighing was 3.5 points of body fat in men and 3.7 in women (Hodgdon and Beckett 1984), so a result of 18% is best read as about 14.5 to 21.5%. Most of the rest of the error is the tape: measure the neck and waist twice, at the same spots, after breathing out. Even the lab methods disagree by about 3 points: DXA and the four-compartment model had a standard error of 3.2 against each other in Gallagher’s 2000 study.
Is 20% body fat ok for a man?+
It depends on age. On the Gallagher 2000 ranges, 20% is the first point of the overweight range for men aged 20 to 39, whose healthy range is 8 to 19.9%. For men aged 40 to 59 the healthy range is 11 to 21.9%, and for 60 to 79 it is 13 to 24.9%, so 20% is inside both.
What is a healthy body fat percentage for a woman?+
On the Gallagher 2000 ranges: 21 to 32.9% at 20 to 39, 23 to 33.9% at 40 to 59, 24 to 35.9% at 60 to 79. Below the bottom of the range is under the body fat that goes with a BMI of 18.5; from the top of it up is the overweight range, and the obesity range starts at 39, 40 and 42% for the three age groups.
What is the healthy body fat percentage range for men by age?+
On the Gallagher 2000 ranges: 8 to 19.9% at 20 to 39, 11 to 21.9% at 40 to 59, 13 to 24.9% at 60 to 79. The overweight range runs from there to 24.9, 27.9 and 29.9%, and the obesity range starts at 25, 28 and 30%.
Can BMI tell your body fat percentage?+
Only roughly. Gallagher’s 2000 equation turns BMI, age and sex into body fat with a standard error of 5.0 points, against 3.5 to 3.7 for the Navy tape. The worked example man, 178 cm and 82 kg at 30, has a BMI of 25.9: the equation gives him 20.7%, his tape 18.0%. BMI cannot tell muscle from fat, which is why it reads him higher.
Do I need my weight for this body fat calculator?+
No. The Navy method uses only your height and the tape. Weight is optional: with it, the result splits your weight into fat mass and lean mass, and the FFMI calculator can use the same numbers.
What is the most accurate way to measure body fat?+
In a lab, a four-compartment model, which combines body density, body water and bone mineral, with DXA scans the usual clinical and sports science reference. Gallagher’s 2000 study used both. At home, a tape method with its error stated, measured the same way each time, is the most honest number you can get, and the trend over weeks says more than any single reading.
How much does my waist change my body fat estimate?+
For the worked example man, 178 cm with a 38 cm neck, each centimeter of waist moves the estimate by about 0.75 points of body fat. For the example woman, 165 cm with a 32 cm neck and 97 cm hips, each centimeter of waist moves it about 0.5 points. That is why the waist is the measurement to take most carefully.
Keep going
FFMI calculator →
Your fat-free mass index from height, weight and body fat, on the charts for men and women, up to the natural limit of 25.
Waist to height ratio calculator →
Is your waist under half your height? Your ratio on the NICE bands, the same boundary for men and women.
Jawline analysis →
Gonial angle and definition, from one photo.
Height calculator →
How tall will you be? Adult height predicted from both parents (mid-parental and Khamis-Roche), plus your percentile on the CDC and WHO charts.